Runalyze is a free tool that I use to view and export my run data. Here are a few of my favorite Runalyze features and how to use Runalyze to access data that Garmin makes quite difficult to get.
Quick intro to Runalyze
For those familiar with Strava, Runalyze similarly syncs with Garmin Connect after each activity and pulls most (all?) of the same information. Unlike Strava, Runalyze isn’t a social network. Your activities are displayed in a table and you can control which variables appear in the columns. Here’s my table from last week:
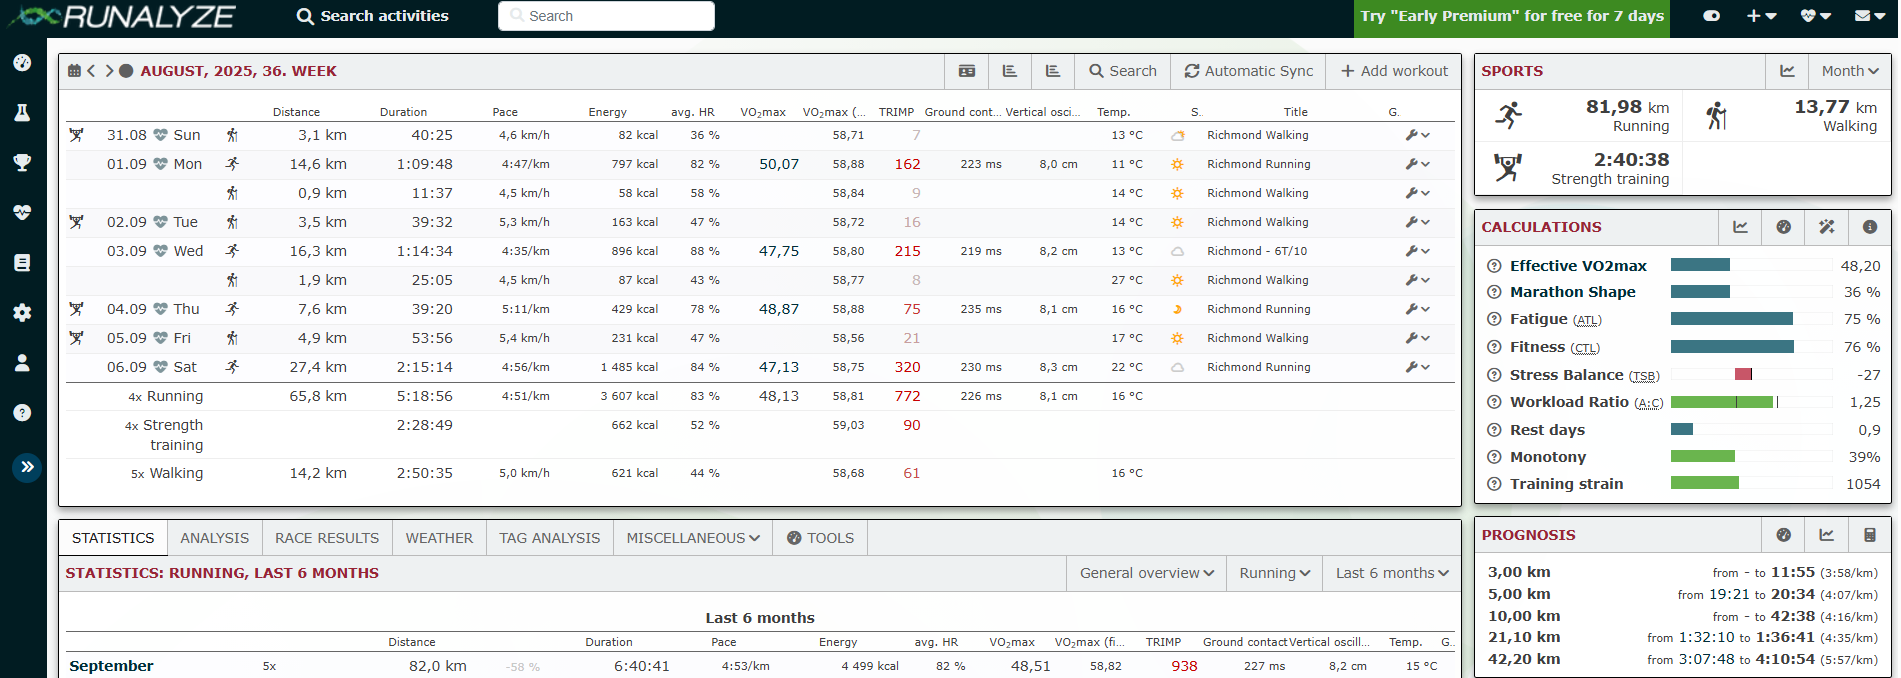
Next to the activity table in the dashboard there are panels that summarize monthly activity data, several measures of training load including Runalyze’s “effective VO2max” and “marathon shape”, and race predictions including comparisons to race PRs. The effective VO2max value is roughly comparable to Jack Daniel’s VDOT (both are almost certainly lower than your Garmin VO2max) and marathon shape is a nifty adjustment of the VO2max-based race predictions for training readiness (long runs and weekly volume).
Viewing data in Runalyze
On the left sidebar follow the Erlenmeyer flask icon (Training Analysis) to select Trend Analysis. Select a time window of interest and limit the sport to just “running” and click “Add plot”. A plot of Pace should appear. In the dropdown, there are lots of metrics available to look at over time.
Garmin notoriously only gives out rounded integer-valued VO2max values (50, 51, etc), but you can see your raw values by selecting VO2max estimate:
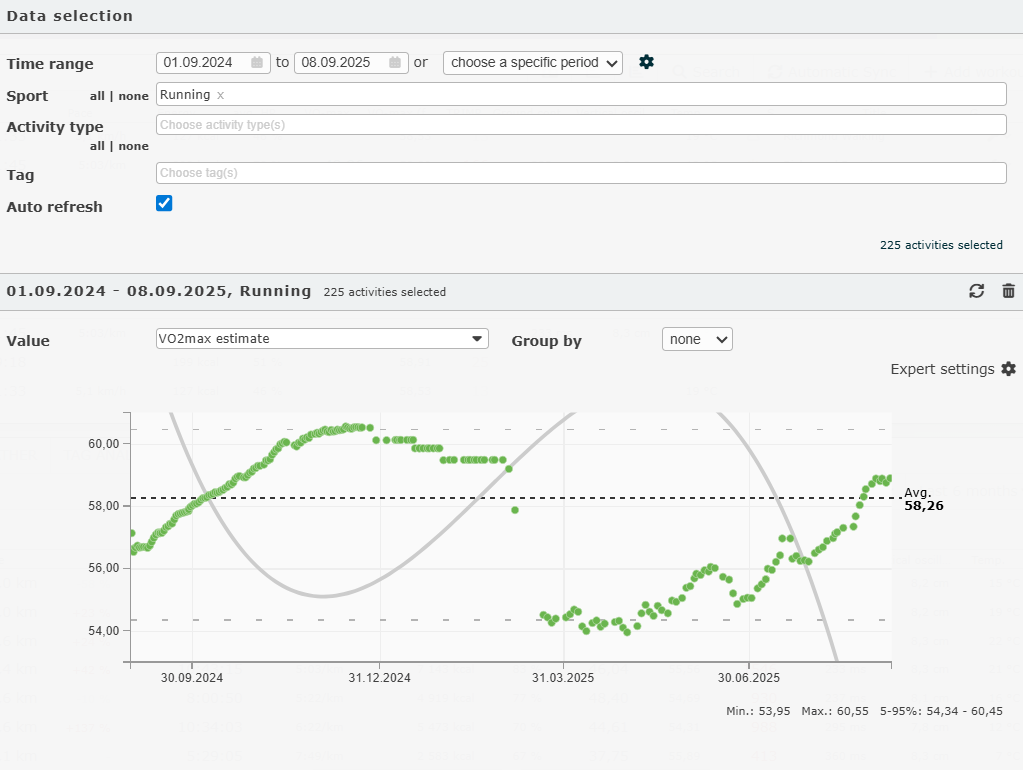
I may at some point do a post on my full return-to-run and how these values changed over time. For now I’ll just note that there are a handful of misplaced values here from various non-run activities that Garmin included as “runs”, for example, treadmill walking, which I did a lot of when my ITBS was at its worst in the winter and early spring. Another interesting variable for my return to run journey is vertical oscillation, the “bounciness” of my stride:
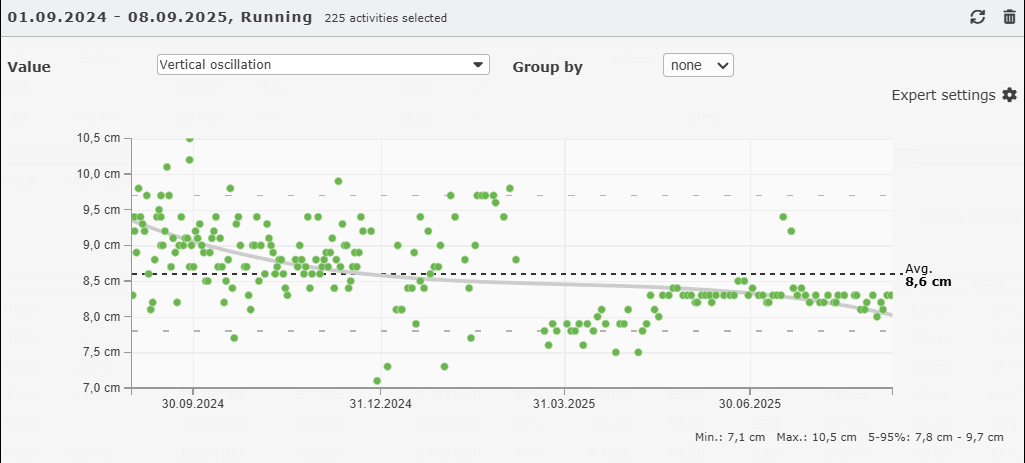
I used to be quite bouncy and my vertical oscillation varied a lot day-to-day, but my current stride appears to be less bouncy and is much more consistent. Notably, since my return-to-run program started with run/walks with a high proportion of walking - and walking has almost no bounce - the vertical oscillation of these “runs” are artifactually lower in April and early May.
How do I download my data?
The Trend Analysis tool is nice for quickly exploring your data, but you might prefer to download your data to work with it elsewhere. On Runalyze, there’s no download button. At one point I learned these tricks for downloading data on Reddit and saved the links. Make sure you’re logged in to Runalyze, and then navigate to this URL - the csv should automatically download:
https://runalyze.com/_internal/data/activities/all
You can also view a json of your daily effective VO2max at https://runalyze.com/_internal/data/athlete/history/vo2max